There are tens of thousands of tradable securities. Money is flowing between these securities and sectors like large schools of fish moving around the sea. But this isn’t actual money, and an investor’s equity is just a sum of entries in ledgers, and based on timing and demand an equity can increase or decrease. The markets can expand and contract, and perceived value of a security can go up and down. Traditional markets are like cryptocurrency markets, except with the former there are legal and often voting rights. Setting that aside, the markets are heavily influenced by mass psychology, and the markets do exhibit having a memory1.

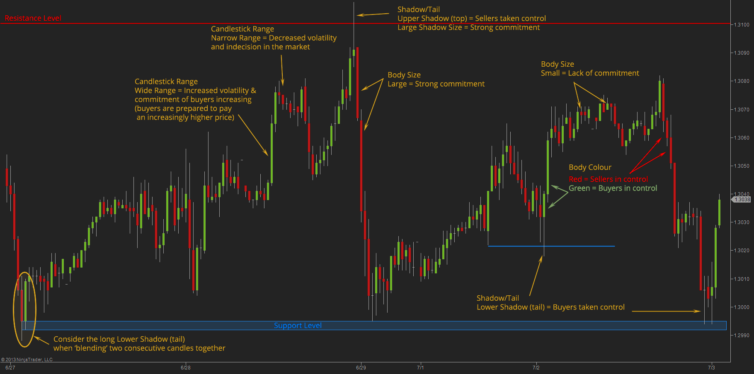
If the market has a memory, or patterns repeat, or macro cycles exist, or pairs of securities move proportionately, or candle patterns have meaning, or if a sector moves with a dominant player… or if a lot of investors believe that any or all of these things are true, then people cause the markets to move, and human behaviour can be somewhat anticipated.
Technical Analysis Theories and Indicators
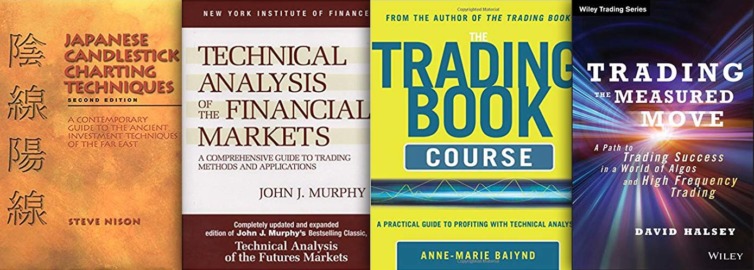
There are a lot of TA theories and strategies presented by experts like Anne-Marie Baiynd (The Trading book), Constance Brown (“Technical Analysis for the Trading Professional”), John Murphy (Technical Analysis of the Financial Markets), and the trader who is credited with bringing Japanese candlesticks to North America – Steve Nison (Japanese Candlestick Charting Techniques).
There are also macro cycle theories such as those from William Gann (Gann Theory) and Ralph Elliot (Elliot Wave Theory). Then there are numerous indicators like Bollinger bands, moving averages, pennants, gaps/windows, stochastics, RSI, money flow, MACD, and on and on. What I’ve learned from many authors is that using them all is using none, and each trader has his or her own favourite indicators.
Machine Learning of Indicators
I love working with others to prepare measured moves for swing trades, but machines can lend a hand. Canada’s IIROC is tightening what retail trading “algos” are allowed to do automatically2, so completely unmanned and automated trading through a retail brokerage is not possible in Canada. Algos can still pour over real-time and historic data assembling strong indicators and/or correlations for thousands of stocks. Indicators are inherently fuzzy and lend themselves better to machine learning (ML) versus hard rules to spot them.
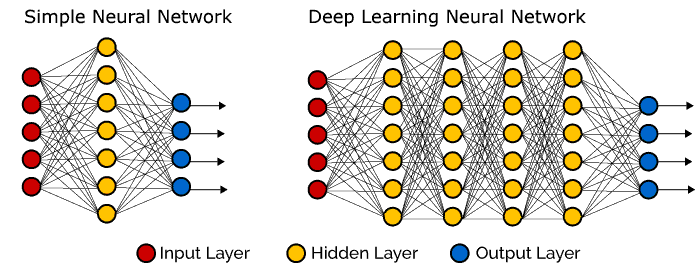
When ML algorithms have been trained and can accurately detect key reversal patterns, then those indicators can be fed into another ML algorithm for forecasting and risk assessment.
Progress of Research
This is my quant research. I’ll add to it over time and I when have exciting results to share.
1. Prepare to Acquire Reliable Candle Data from the Exchanges
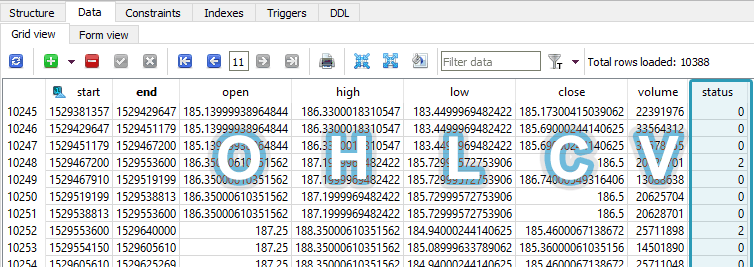
Technical Analysis may be the easier of the processes. The first step is to acquire candle data for quant research. This is needed to train the ML algos and for backtesting. The link above explains what is involved in obtaining daily stock and index candle data.
2. Store Financial Time-Series Data Efficiently
The next step is deciding how to store the candles and how to clean3 them. How do we expect the database to grow, and does it make sense to have a monolithic database or smaller distributed ones?
3. Store Financial Numbers as Integers
Money numbers can be stored efficiently when represented as integers.
4. Clean Raw Candle Data for Time-Series Analysis
Before time series analysis we need to retrieve just the valid, full-period candles, which may even be extrapolated and exclude invalid raw candles. Without this cleaning step, if for instance, five-day candles for the same day make their way into a time series analysis, it would confuse the analysis and perhaps lead to erroneous moving average calculations. Here is the method I use to clean the raw candles from the broker API.
5. Consume Exchange API Candle Data
A real-time financial REST API must be continuously called and data consumed around the clock, but it is prone to all kinds of server trouble: downtime, illogical errors, OAuth failures, and more. The API client daemon must never crash or else one-shot data could be missed and lost forever. Here are the challenges involved in dealing with this finicky financial API.
6. Consume Financials and Sentiment Data
Technical analysis (TA) can be like reading Tarot cards, so to aid in analysis, the financials, earning dates, and sentiment of most medium-to-large companies must be consumed and stored efficiently. This allows top-down analysis of many companies to learn factors such as debt loads, P/E ratios, current ratios, current floats, and so many more.
7. Continually Back up Hundreds of Gigabytes of Stock Data
The stock data acquired grows by about 72GB per year. Cloning RAIDed hard drives for backup takes most of a day each week. This has resulted in the need for automated big data backup. Here I implement AWS Glacier for inexpensive long-term storage, and explore some strategies for continuous backups.
More to come…
Notes:
- This is contrary to the random walk theory of stock markets. ↩
- See IIROC rule 3200 ↩
- Raw candle data from a broker will not be research-grade data ↩


