Storing Financial Time-Series Data Efficiently
How large could financial data grow and cost?
Each candle has OHLCV data plus a Unix timestamp in seconds (Note: I chose this timestamp structure to aid in cleaning the candles without the need for a slow Date interpreter. Statistical languages like R and trading platforms like NinjaTrader or MetaTrader natively use human-readable date-time strings). I go through some napkin math below.
Initial Schema
Here is the bare minimum needed to encode OHLCV data.
| Timestamp | Open | High | Low | Close | Volume |
|---|---|---|---|---|---|
| INT 4 bytes | REAL 8 bytes | REAL 8 bytes | REAL 8 bytes | REAL 8 bytes | INT 4 bytes |
4B + (8B * 4) + 4B = 40 bytes/candle
Better Schema
A start and end timestamp are needed, so the updated structure looks like the following.
| Start | End | Open | High | Low | Close | Volume |
|---|---|---|---|---|---|---|
| INT 4 bytes | INT 4 bytes | REAL 8 bytes | REAL 8 bytes | REAL 8 bytes | REAL 8 bytes | INT 4 bytes |
4B + 4B + (8B * 4) + 4B = 44 bytes/candle
Efficient Schema
The overwhelming majority of the people who have come before me recommend using integers instead of floats or reals (doubles). There are two very strong reasons for this: decimal representations introduce rounding errors (especially in keeping accurate track of forex pips), and analysis software handles integers much faster. With SQLite the size of the INT actually varies depending on the magnitude of the column. I also added a status column to help clean the candles.
| Start | End | Open | High | Low | Close | Volume |
|---|---|---|---|---|---|---|
| INT 4 bytes | INT 4 bytes | INT 1~8 bytes | INT 1~8 bytes | INT 1~8 bytes | INT 1~8 bytes | INT 4 bytes |
4B + 4B + (4~8B * 4) + 4B = Between 16 bytes/candle and 44 bytes/candle
Expected space increase per day
I established previously that (at this time) there are about 48,750 quotable symbols, but let’s round that to 50,000 symbols. How much storage will one day of candles require? Let’s assume there is at least one trade per day for each symbol and nothing is halted or delisted this day.
50,000 day candles * 44 bytes = 2,148 KB ≈ 2.1 MB per day
Worst case minute-candle space per day
It is more challenging to estimate the space required for minute candles because not all symbols move every minute. A thinly-traded warrant might only have a handful of trades in the 390 minutes of in-hours trading (6.5 hours * 60 minutes = 390 minutes) whereas FB or AAPL may have up to 960 minute-candles due to pre-market and after-hours trading.

It turns out popular stocks, especially those on the NASDAQ, like FB and AAPL start trading at 4 AM ET (5.5 hours early) and finish after-hours by 8 PM ET (4 hours after the bell) – that’s a full 16 hours of trading. This is what I have access to via my real-time API, anyway.
Let’s calculate the worst-case in-hours candle data space:
50,000 minute candles * 390 minutes/day * 44 bytes/candle ≈ 818 MB per day!
Estimated real minute-candle space per day
Let’s assume there isn’t a panic crash today and the average number of trades per symbol is 10% of worse-case, or 39 candles/day, then
50,000 minute candles * 390 minutes/day * 0.1 * 44 bytes/candle ≈ 82 MB per day
The actual number fluctuates wildly day after day, but PINX stocks don’t move as much as AAPL. I started with an optimistic estimate of 84 MB/day as our storage requirement (82 MB + 2 MB). It will take time to know what the real average is.
Some time goes by…
Measured candle space per day
It’s good to start with estimates to get ballpark requirements. Now let’s actually calculate the data growth and see how close I came to the optimistic estimate. Using a 10-trading-day period from Monday, July 9th, 2018 at midnight until Friday, July 20th, 2018 at 23:59 ET time, a helper program calculated this:
Candles added since 2018-07-09:
OneDay: 742203
OneMinute: 68556081
The space required, averaged over 10 trading days, then becomes:
One day: 742,203 day candles / 10 days * 44 bytes/candle ≈ 3.1 MB per day
One minute: 68,556,081 minute candles / 10 days * 44 bytes/candle ≈ 288 MB per day
It turns out my optimistic estimate of 10% was quite off1. From the above, the percentage-from-worst is closer to 35%. We can then say that all the available quotable symbols “move” only 35% of the time on average.
Estimated storage space per year
There are about 252 regular U.S. trading days per year.
365.25 (avg. days per year) * 5/7 (5 trading days a week) = 260.89 – 9 (U.S. holidays) = 251.89 days ≈ 252 days
Canada trades on some U.S. holidays, and the U.S. trades on some Canadian holidays, but let’s use the 252 trading days a year. The napkin math then becomes:
252 days * 291 MB/day = 73,332 MB/year ≈ 72 GB per year!
Assuming equal turnover of symbols (which is not the case2), we would need to be prepared to store about 72 GB of candle data per year over and above storing all the historic data we want.
Estimated AWS storage cost per year
Let’s make an assumption that we have one year of historic data, or 72 GB of clean OHLCV candle data already. Where exactly does that data reside? A local MySQL database? Would SQLite work? How about Amazon AWS’s RDS solution?

If we are just accumulating candles each day for storage, then it requires a minimum of 33 database-hours per week. If we want to accumulate and analyze the candles, then at least 88 database-hours per week are needed:
6.5 hours/day * 5 days/week = 32.5 hours/week ≈ 33 hours/week (storage)
24 hours – 6.5 hours = 17.5 hours/day ≈ 88 hours/week (storage + analysis)
With a 72 GB general SSD3 and 293 MB/day inbound (free), the AWS costs are:
| DB Instance | 33 hours/week | 88 hours/week |
|---|---|---|
| db.t2.medium (2 CPUs, 2 GB) | US$15.64/mo | US$31.76/mo |
| db.t2.xlarge (4 CPUs, 16 GB) | US$109.07/mo |
Say you have 2 years of historic data, or 144 GB:
| DB Instance | 33 hours/week | 88 hours/week |
|---|---|---|
| db.t2.medium (2 CPUs, 2 GB) | US$23.92/mo | US$40.04/mo |
| db.t2.xlarge (4 CPUs, 16 GB) | US$117.35/mo |
Say you have 5 years of historic data, or 360 GB:
| DB Instance | 33 hours/week | 88 hours/week |
|---|---|---|
| db.t2.medium (2 CPUs, 2 GB) | US$71.76/mo | US$100.73/mo |
| db.t2.xlarge (4 CPUs, 16 GB) | US$165.19/mo |
This doesn’t include the hardware running the TA algorithms or where our intermediary data (for indicators) resides. With this approach, we are most likely losing money on trades and on database usage fees. While convenient, let’s not use AWS or any cloud-hosted solution.
Distributed local SQLite databases
There are advantages with using SQLite databases over monolithic databases: speed, transportability, and scalability. In my setup, the combined candles DB for AAPL is under 10 MB. If I need to perform heavy analysis on tech alpha-dog Apple, I can load the entire candle DB into a SQLite in-memory store. If I need to see how that other NASDAQ securities move in relation and/or response to Apple, then the other 3300 or so of those securities can be loaded into distributed memory – it’s ballpark 30 GB of RAM to hold it all.
notime in /etc/fstab on the mounted folder holding the SQlite databases to reduce file activity and speed up IO.Small, individual databases can be replicated across clusters on file systems such as GFS, GlusterFS, and Hadoop. This scales well on inexpensive hardware too. I just wouldn’t know where to begin with a monolithic 360 GB MySQL database entrenched in a standalone file system while keeping cost down.
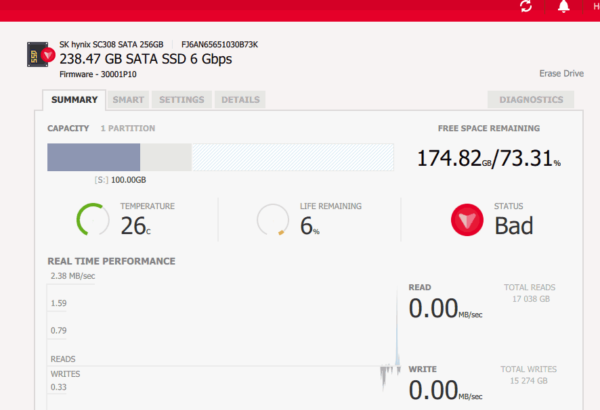
Update 2018-10: It is better to not use a local SSD to store real-time stock data as it comes in over the wire or to post-process data. This was after 8 months with just 15 TB of writes (on a less popular SSD brand):

I now use RAID-1 HDDs to record daily candles.
Notes:
- I actually just guessed because I was going to calculate it anyway. ↩
- “One trend that needs to be highlighted is the number of listed companies in the US: over the past 20-years from 1996 to 2016 they have been falling by half from approx 7,322 to 3,671” Source: WorldBank.org ↩
- Do not use an SSD to record real-time stock data. See below. ↩