PHP Debugging with PhpStorm and Xdebug
Here’s how to go about debugging, stepping through, and profiling remote code like a breeze. These are the steps I took to install/enable Xdebug on a remote LAMP stack and debug/profile hosted code using PhpStorm and a Chrome extension. As a bonus I’ll share how I debug cURL requests with Xdebug too.
1. Setup remote hosting with SSH access
I’m using a VMWare development machine with a CentOS LAMP stack to mirror a production RHEL environment. You can use a shared host with SSH access, an AWS EC2 instance, or XAMP/WAMP/MAMP if you like. As long as you can SSH into the server and install Xdebug then you can try this out and speed up your debugging. No more echo "AAAA" statements.
2. Install or compile Xdebug
Xdebug may already be installed and running. You can check first like so.
1 2 | > php -m | grep Xdebug Xdebug |
If it is, then you can move on to the next step. Otherwise, let’s install or compile Xdebug with the official install docs from xdebug.org.
3. Configure Xdebug
First, find out which php.ini file is being parsed. Here is an example from CentOS:
1 2 3 | > php -i | grep 'Configuration File' Configuration File (php.ini) Path => /etc/php5/apache2/ Loaded Configuration File => /etc/php5/apache2/php.ini |
Here are a couple choices of ini files to edit:
- You can edit the master
php.iniin/etc/php5/apache2/php.ini - You can edit
xdebug.iniin/etc/php5/apache2/conf.d/xdebug.ini
If you see a path that has “cli” in it, be aware that may be the command line interface php.ini which will be different than the one Apache PHP uses (the default is mod_php).
I prefer to specify the path to php.ini in one of my Apache config files. For example in httpd.conf I have:
1 2 | # Put php.ini in this folder PHPINIDir /var/www |
Whichever file you choose to hold your configuration settings, here are the settings I used to enable robust debugging:
1 2 3 4 5 6 7 8 9 10 11 12 13 14 15 16 17 18 19 20 | [xdebug] ; Debug settings zend_extension = xdebug.so xdebug.remote_enable = On ; Enable xdebug xdebug.remote_autostart = Off ; Only start xdebug on demand, not on every request ;xdebug.remote_host = "localhost" ; This is unused if the next setting is 'On' xdebug.remote_connect_back = On ; Use a special $_SERVER['...'] variable to get the remote address xdebug.remote_port = 9000 ; Port on the IDE to connect back to. Usually it is 9000 xdebug.idekey = "PHPSTORM" ; The IDE key which should match the XDEBUG_SESSION cookie value xdebug.remote_handler = "dbgp" ; Select a connect-back IP from the $_SERVER['...'] value set in a custom header ; See the bonus section at the very bottom for details on using this xdebug.remote_addr_header = "HTTP_X_XDEBUG_REMOTE_ADDRESS" ; These are optional profiling settings xdebug.profiler_enable = Off ; Profiling not activated by default xdebug.profiler_enable_trigger = On ; Profiling activated when requested by the GET parameter xdebug.profiler_output_name = "cachegrind.out.%t-%s" ; See the note below about this xdebug.profiler_output_dir = "/tmp/xdebug/" |
Be sure to set xdebug.remote_autostart = Off to prevent your server from crawling on every page request. If it is On that means Xdebug will always try to start a remote debugging session which is probably not what you want.
If you are interested in fine-tuning your Xdebug, here are all the settings you can adjust. If you are for now mainly interested in halting code at breakpoints in PhpStorm, or profiling code, then let’s continue.
You may want to ensure the write permissions are set to allow Xdebug to write to “/tmp/xdebug/”. This shouldn’t be a problem out of the box. It’s just a gotcha if you find that no profiling logs are being written.
If you are wondering why xdebug.remote_host is commented out above, here is an interesting point from the official docs that says why you can safely omit it:
xdebug.remote_connect_back
Type: boolean, Default value: 0, Introduced in Xdebug > 2.1
If enabled, the xdebug.remote_host setting is ignored and Xdebug will try to connect to the client that made the HTTP request.
Restart Apache with apachectl restart or systemctl restart httpd.service (CentOS 7), or /etc/init.d/apache2 restart on Debian.
4. Setting the Debugger Configuration in PhpStorm
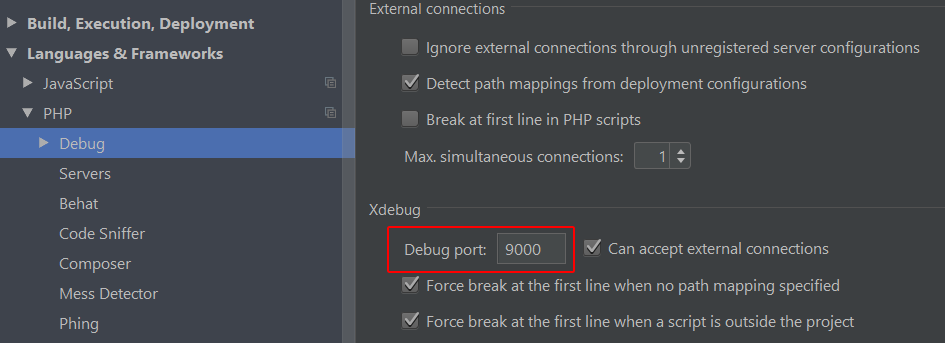
JetBrains, the maker of PhpStorm, has detailed instructions on configuring Xdebug in their IDE. There are a few places settings need to be set, so I defer to their help pages. Essentially, you want to set the Xdebug IDE port to 9000 and the IDE key to PHPSTORM.
5. Triggering Xdebug
On a development box it’s sufficient for the server to connect back to port 9000 on the IDE over HTTP. To connect over an SSH tunnel, here is a guide from the makers of PhpStorm: Remote debugging in PhpStorm via SSH.
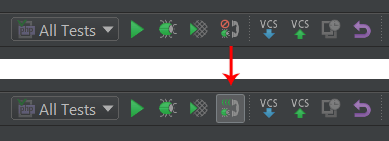
First, you must tell PhpStorm to listen for Xdebug connections by clicking the “phone” icon like so:
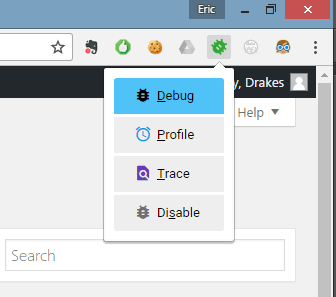
To trigger debugging, it’s necessary to send a special cookie along with each page request you wish to debug: XDEBUG_SESSION=PHPSTORM
To simplify this, Chrome has an extension called Xdebug helper that let’s you toggle setting this cookie or not.
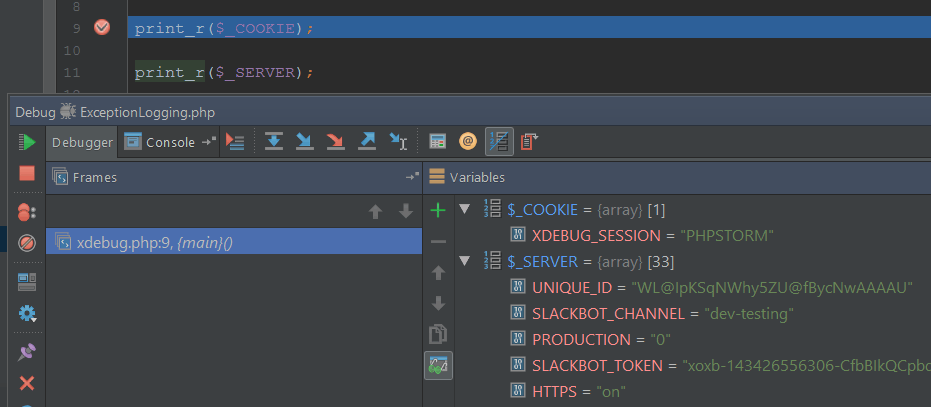
With the above settings and the Chrome helper, you can now step through PHP code at breakpoints set in the IDE.
The above is great for debugging simple scripts, but what about scripts called with cURL?
6. Bonus: Xdebugging cURL Requests
If you’re using the settings from step 1, then you have all the tools to Xdebug PHP requests from cURL or wget. It’s actually pretty simple to Xdebug PHP files called from cURL. I’ll present a method for the CLI and from PHP curl.
The method is to set the XDEBUG_SESSION cookie, and to send the connect-back IP in a custom header. With the settings from step 1, Xdebug will examine $_SERVER['HTTP_X_XDEBUG_REMOTE_ADDRESS'] for the IP to connect back to. In order to set that from a custom header you must set the header as
X-Xdebug-Remote-Address
not
HTTP-X-Xdebug-Remote-Address
as you must not add the ‘HTTP-‘ part in front because it will be added automatically.
CLI cURL Xdebug
1 | `which curl` --cookie "XDEBUG_SESSION=PHPSTORM" --header "X-Xdebug-Remote-Address: 192.168.40.110" http://beta.example.com |
You can set the cookie and header on the command line as in the above example.
PHP cURL Xdebug
You can set the cookie and header in an options array using curl_setopt() below.
1 2 3 4 5 | // Include this in your curl request curl_setopt($ch, CURLOPT_HTTPHEADER, array( 'X-Xdebug-Remote-Address: 192.168.40.110', 'Cookie: XDEBUG_SESSION=PHPSTORM' )); |
Even better and more convenient is to set the connect-back address dynamically
1 2 3 4 5 | // Include this in your curl request curl_setopt($ch, CURLOPT_HTTPHEADER, array( 'X-Xdebug-Remote-Address: '.$_SERVER['REMOTE_ADDR'], 'Cookie: XDEBUG_SESSION=PHPSTORM' )); |
The above will set the IP address of the caller to the PHP script that initiates the cURL request (i.e. the browser on the same machine as the IDE). I make curl requests to other sites in my web ecosystem, so this is a very convenient way to debug those requests also.
7. CLI scripts and Xdebug
While in the shell you can set an Xdebug configuration environment variable with the IP address of the machine where your IDE is. Before you run your PHP scripts (e.g. >php -dzend.assertions=1 -dassert.exception=1 script.php), you can enable debugging for the life of the shell session with this:
1 | export XDEBUG_CONFIG="remote_enable=1 remote_mode=req remote_port=9000 remote_host=192.168.40.100 remote_connect_back=0" |
Conclusion
Xdebug is amazing and invaluable. If you start Xdebugging like this, you will never go back to print_r or var_dump or echo 'AAAA' ever again.