Acquiring Candle Data for Quantitative Financial Analysis Research
This would make a good interview question:
- There are about 120,000 public North American securities, bonds, rights, and index symbols.
- You have a paid API that can access all of them in OHLCV1 format if they are quotable.
- There are two critical API constraints2:
- 15,000 calls per hour
- 20 calls per second
Napkin math
Minute candles are the most valuable, followed by day candles. Other time scale candles can be assembled from these without the need for unnecessary storage. Without any other information, the number of daily API calls would be:
120,000 symbols x 2 = 240,000 API calls needed
We are only allowed 15,000 calls per hour, so
240,000 calls / 15,000 calls/hr = 16 hours
It looks like the worst case time frame is 16 hours per day of constantly calling the broker API endpoint to get the candle data for every North American symbol. A trading day goes from 09:30 until 16:00 Toronto time – 6.5 hours of trading3. If we start the API call algorithm right at EOD, then 16:00 plus 16 hours means we would have all the previous day data by 08:00 the next morning. In theory with this approach, we will not have a data deficit. BUT, there will only be a scant 1.5 hours to perform technical analysis before placing the new day’s orders.

Single-threaded or multi-threaded?
Can we get away with a synchronous call algorithm? Let’s see.
15,000 calls/hr ≈ 4.16 calls/s ≈ 240 ms/call
For a single-threaded for-loop to succeed, each API call, including the overhead of DB storage, can take at most 240ms. I can tell you that this is an unreasonable assumption because:
- A security with more trades4 has a bigger JSON payload which increases transit time
- The broker’s servers go down for daily maintenance
- There are weekly server problems
- The downtime varies
- The broker does not gzip their API responses5
From experience, some requests take over a second to process. The proposed algorithm must make asynchronous API calls.
Do we really need to make 240,000 API calls?
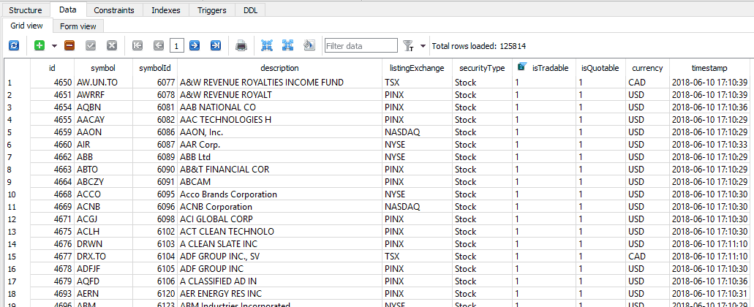
When I built my production algorithm, I did the math and it seems extreme to make 240,000 API calls per day. So, how to know which symbols to call and which to defer or ignore altogether? The symbols have flags to indicate if they are quotable and/or tradable (and much more). I wrote a helper class to enumerate the Cartesian products of the combination of types of symbols. Here is a high-level breakdown to the types of symbols:
Number of symbols: 122857
Number of quotable symbols: 48753
Number of non-quotable symbols: 74853 ← %61!
Number of only-quotable symbols: 19287
Number of tradable symbols: 29466
About 61% of the symbols are non-quotable. The breakdown of these symbols are:
| Security Type | Count |
|---|---|
| Currency | 4 |
| -Not set- | 38 |
| Commodity | 66 |
| Right | 3351 |
| Mutual Fund | 8367 |
| Bond | 11077 |
| Index | 11891 |
| Stock | 40084 |
All kinds of securities are not tradable. Why? Drilling down into the stocks in the breakdown reveals that all of them are no longer trading! Did they go bust? Maybe. It turns out that there is a lot of symbol turnover through name changes and delistings due to mergers, acquisitions, bankruptcies, and other reasons. At this moment in time, there are 48,753 quotable symbols.
48,753 symbols x 2 = 97,506 API calls needed
97,506 calls / 15,000 calls/hr = 6.5 hours vs. 16 hours
We’re now down to about 6.5 hours of API calls.
Do all symbols have equal priority?
We’ve established that we can process all the quotable symbols in about 6.5 hours. If the market closes at 16:00 Toronto time, then we can only start technical analysis from 22:30. AWS Labmda6 processing time is least expensive at night, so this is a silver lining. However, the next question to ask is if we need all the symbols before we start TA. If the answer is no, then which symbols can be deferred or excluded?

Here is a breakdown of the quotable symbols by exchange:
| Quotable Security Exchange | Count |
|---|---|
| OPRAI | 2 |
| OTCBB | 34 |
| TSXI | 47 |
| NEO | 82 |
| S&P | 259 |
| ⋮ | ⋮ |
| TSXV | 2150 |
| TSX | 2332 |
| NYSE | 3253 |
| NASDAQ | 3393 |
| NASDAQI | 15033 |
| PINX | 15999 |
Serious day and swing traders don’t bother with PINX, and the NASDAQI are niche indexes that aren’t as valuable as bigger indexes. Deferring them until the late evening or weekend saves about 31,000 x 2 API calls.
Number of quotable symbols excluding PINX and NASDAQI: 17648
The napkin math then becomes:
17,648 symbols x 2 = 35,296 API calls needed
35,296 calls / 15,000 calls/hr = 2.35 hours vs. 16 hours

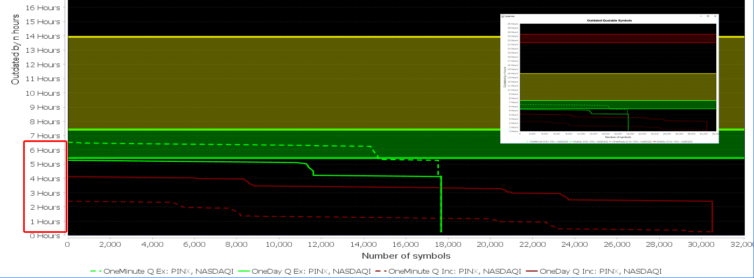
Above is a diagnostics chart (with JFreeChart) that shows the real progress of the API calls and how outdated the symbols are. The green lines are symbols excluding PINX and NASDAQI, and the red lines are those including them. The yellow band is the trading period. The green band is an approximate after-hours trading band. The red band is when the broker servers are notorious for going down. This real acquisition of all the quotable 1-minute and 1-day candles completed in about 6.5 hours as expected.
Next: The next step is to figure out the storage footprint, database architecture, and how to deal with multi-threaded concurrency of the databases: Storing Stock Candle Data Efficiently
Notes:
- OHLCV = Open, High, Low, Close, Volume ↩
- https://www.questrade.com/api/documentation/rate-limiting. ↩
- 6.5 hours of in-hours trading that does not include pre-market and after-hours trading. For example, when Facebook crashed on July 25, 2018, after-hours trading went on until 20:00 Toronto time! ↩
- For example, AAPL or DJX ↩
- I’ve called API support on this, and they refuse to implement gzip because of the extra CPU power required ↩
- https://aws.amazon.com/lambda/ ↩
