Profile Remote Java Apps with VisualVM or JMC
Here is the end result of our efforts.
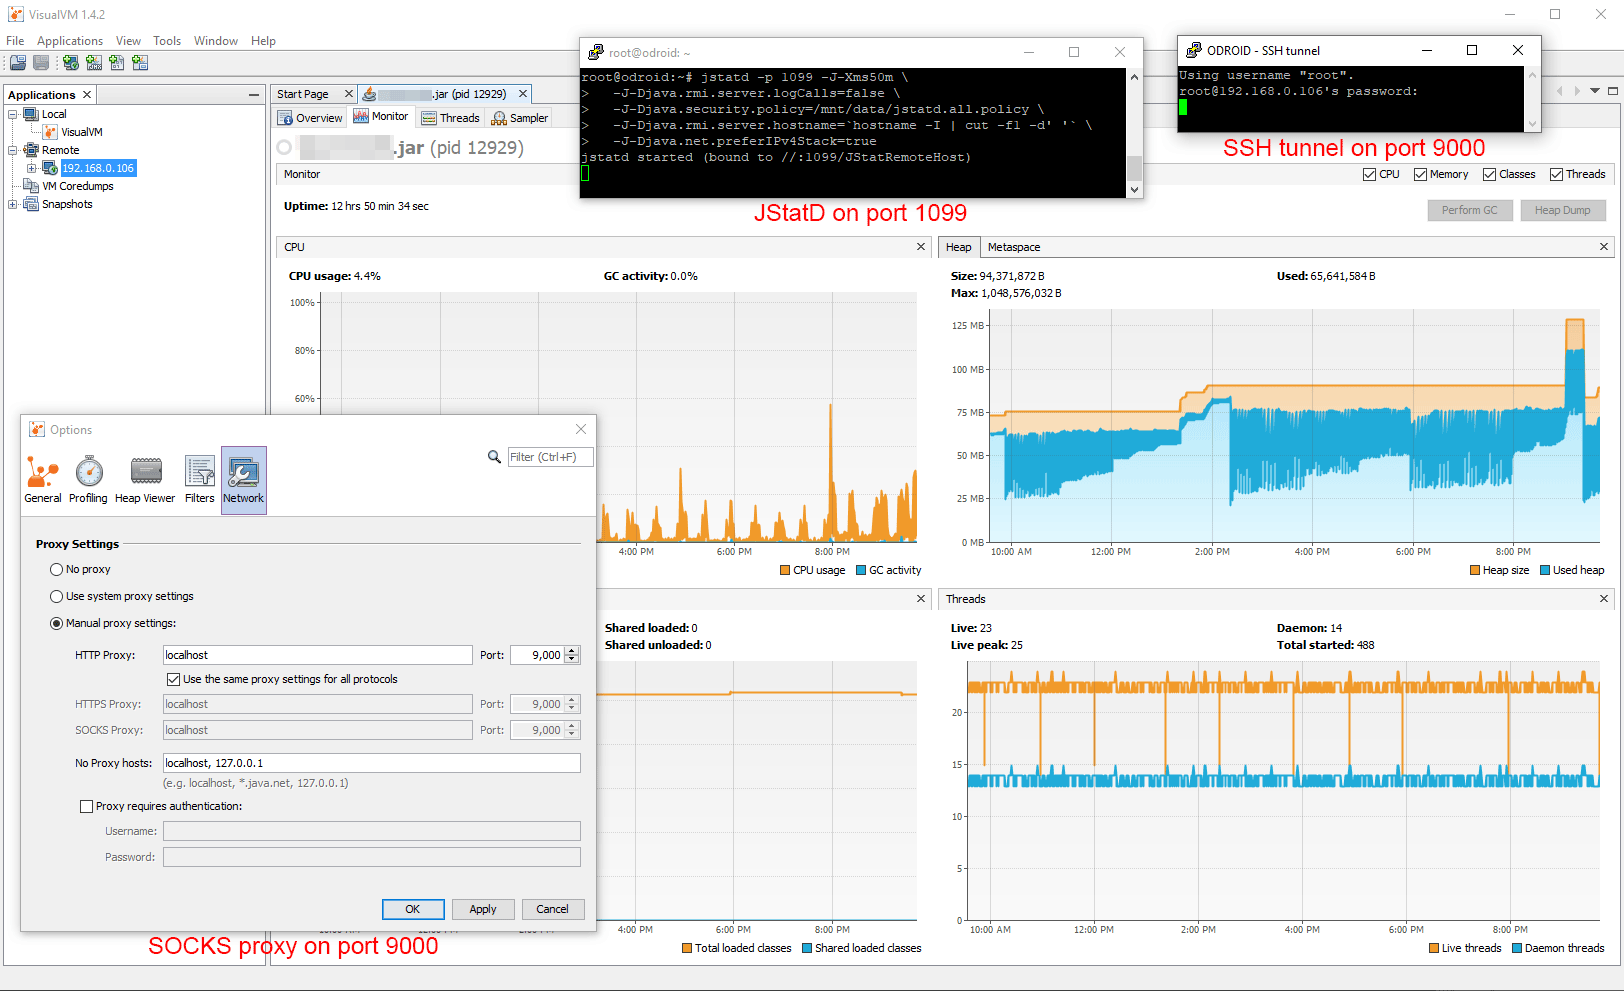
Being able to profile remote Java apps lets us visualize memory leaks that might not happen for hours.
Motivation: The OOM killer on my ODROID XU4 running Bionic (Ubuntu 18.04) comes to life now and then killing my important Java daemon process. I’d like to know why. Is my Java process leaking memory? Is another process growing uncontrollably? I’ll take a trip through system logs, then install and start up an RMI server JStatD daemon under JDK 112, set up a SOCKS5 proxy, and finally, connect to my embedded SBC with VisualVM to profile the Java memory usage.
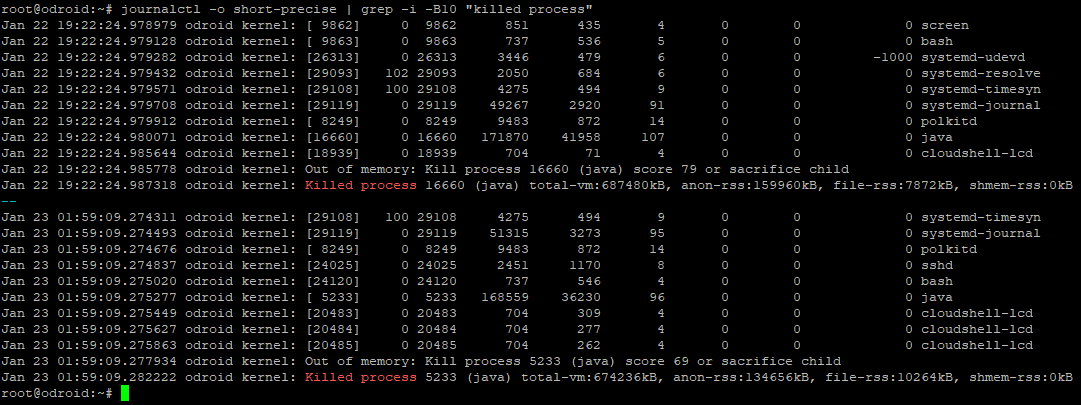
First, here is how I found out how often processes are killed:
1 2 | # Show each killed process and the preceding 50 lines journalctl -o short-precise | grep -i -B50 "killed process" |
To prevent my Java app from ever being killed, I gave it a low OOM score like other critical processes have (e.g. sshd) as a temporary Band-Aid solution:
1 2 3 4 5 6 7 8 9 10 11 12 | # Get the PID of the manually-started Java process ps -a | grep java # Set the OOM score to -17 (that's the constant OOM_DISABLE) # REF: https://linux-mm.org/OOM_Killer echo -17 > /proc/xxxx/oom_adj # Confirm and view all OOM-disabled processes (i.e. sshd, dbus-daemon) # REF: https://askubuntu.com/a/995278 while read -r pid comm; do printf '%d\t%d\t%s\n' "$pid" "$(cat /proc/$pid/oom_adj)" "$comm" done < <(ps -e -o pid= -o comm=) |
Next, let’s see what htop shows us. I’ll just look at the top usage.
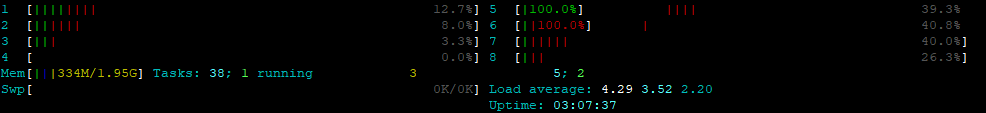
I restarted the machine about three hours ago and the real memory has grown to 334MB. What is causing the memory increase?
systemd-journal grew to over 200MB which spun up the OOM killer. This was because the process cloudshell-lcd was calling a program smartctl to get the HDD temperature multiple times per second, but it wasn’t installed (apt-get install smartmontools solved this). Each failure resulted in a new log entry which, for the current boot session, was resident in memory and growing. Journald was then limited in memory usage.Having identified and hopefully solved the memory issue, I’d just like to be thorough and see how my Java agent process is performing. Let’s get started with remote profiling.
Step 1. Install the Java JDK on the remote system
The JRE is installed because Java processes are running. We need a small server tool called jstatd to listen on a couple of ports for VisualVM to communicate with and attach to running JVMs. This tool is a development tool, so the Java JDK is required. Since Java 8 is officially not receiving free updates from Oracle any longer (as of January 2019), it’s really time to upgrade to JDK 11.
1 2 3 4 5 6 7 8 9 10 11 12 13 14 15 | # See the available OpenJDK versions apt update && apt search openjdk # Remove OpenJDK along with dependencies and configuration files apt-get purge --auto-remove openjdk* # Install the latest JRE and SDK for embedded systems (headless = no-GUI components) apt-get-install openjre-11-headless apt-get install openjdk-11-headless # Verify the installation java -version javac -version # Restart the Java processes or the machine |
Step 2. Create the JStatD security policy file
Many of the guides I’ve found are valid up to Java 8. From Java 9 everything changes. These are the steps to take for Java 11 and hopefully beyond.
If you are looking for tools.jar from another guide, it’s gone – replaced with jdk.jstatd in the policy file. More on that next.
For security reasons the jstatd process cannot attach to any JVM, so it needs a security policy file. For JDK 11 an all-permissive policy file is shown below. Notice that permissions need to be given for jvmstat as well, another departure from previous Java 8 guides. This is not recommended for a production machine running, say Tomcat, but is good enough for small embedded SBCs3 and machines.
1 2 3 4 5 6 7 8 9 | # Save this somewhere memorable like ~/jstatd.all.policy # REF: https://stackoverflow.com/a/51032943/1938889 grant codebase "jrt:/jdk.jstatd" { permission java.security.AllPermission; }; grant codebase "jrt:/jdk.internal.jvmstat" { permission java.security.AllPermission; }; |
Step 3. Start the JStatD server daemon
Let’s start the jstatd RMI server daemon using this command.
1 2 3 4 5 6 7 8 | # Start the jstatd server listening on port 1099 and a *random* port. # Also, log RMI traffic, use the security policy from above, # use an IP address as a hostname, and use IPv4 port bindings jstatd -p 1099 -J-Xms50m \ -J-Djava.rmi.server.logCalls=true \ -J-Djava.security.policy=~/jstatd.all.policy \ -J-Djava.rmi.server.hostname=192.168.0.106 \ -J-Djava.net.preferIPv4Stack=true |
-J-Djava.rmi.server.hostname=IP is needed to indicate that our embedded device’s IP is the hostname to work properly with VisualVM. If you connect with a hostname (set in a hosts file) then this parameter is not needed.-Djava.rmi.server.hostname=`hostname -I | cut -f1 -d' '` to automatically get the private server IP address, or use simply `hostname -f` to use the server hostname. Your mileage may vary.Now the process is running in the background and listening on two ports. One port is the “rmiservice” port 1099, and the other port is… random. Let’s find out that port next.
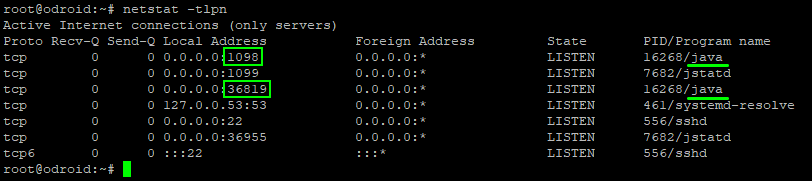
1 2 | # Find the listening TCP ports netstat -tlpn |
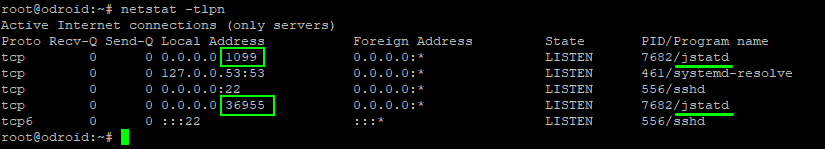
In this example, the random port is 36955. Now, how do we open the firewall to a random port? The answer is… transparently.
netstat -tlpn and find both jstatd ports. If using UFW, run ufw allow 1098,1099,xxxx,yyyy/tcp where xxxx and yyyy are the random ports for JStatD and JMX (see step 6). When you are finished, you can run ufw delete allow xxxx for each port. Be warned that you will need to open four ports.Step 4. Create an SSH tunnel with a SOCKS5 proxy
This is actually easier and safer than poking holes in the firewall. Let’s create a dynamic SSH tunnel to the remote JVMs that bypasses the firewall as far as VisualVM is concerned. This way that random port can be connected to transparently.
Linux SSH tunnel
On Linux it is as simple as can be. Open a new terminal, run this command, and minimize the terminal. Our SSH tunnel will be accessible on local port 9000. To exit, press ctrl+c as usual.
1 2 | # Create an SSH tunnel locally on some unused port ssh -v -D 9000 192.168.0.106 |
Windows SSH tunnel with PuTTY
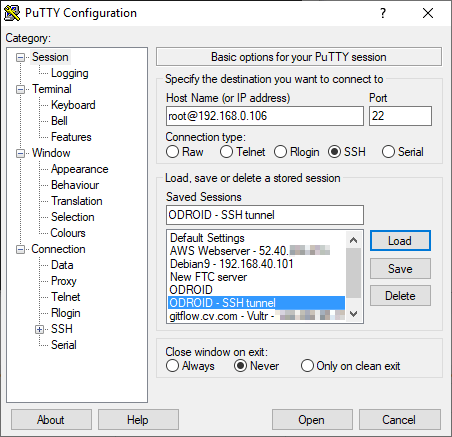
You can open a command window and run plink.exe, but the PuTTY GUI is more fun with settings for SSH keys and logging. Let’s set up an SSH tunnel with PuTTY.
First, create or duplicate your SSH connection settings that you normally shell into with.
In the SSH setting, check “Don’t start a shell or command at all” as this is just a tunnel, not a shell window. It’s also a good idea to enforce SSH version 2 since we are here.
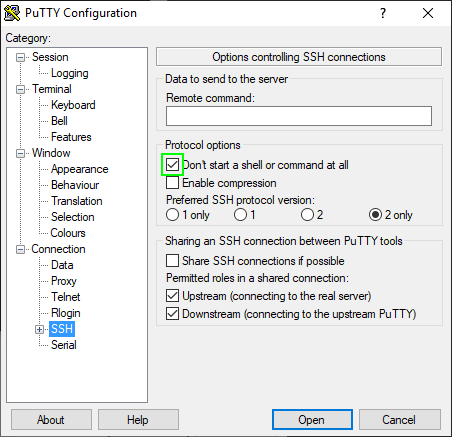
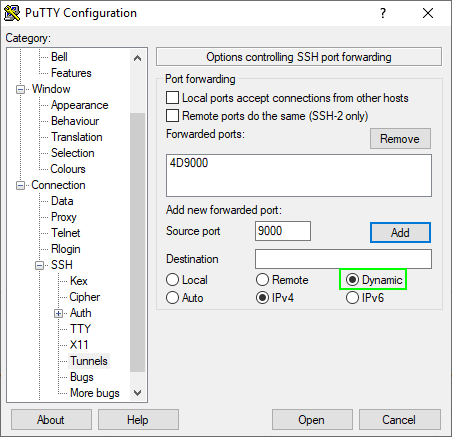
Window > Behaviour and set the window title to something like “SSH Tunnel”.Next, and most importantly, be sure to set a dynamic destination. Do not select either “local” or “remote”. We want the tunnel to terminate at essentially the NIC so we can connect to any port we like as the authenticated user.
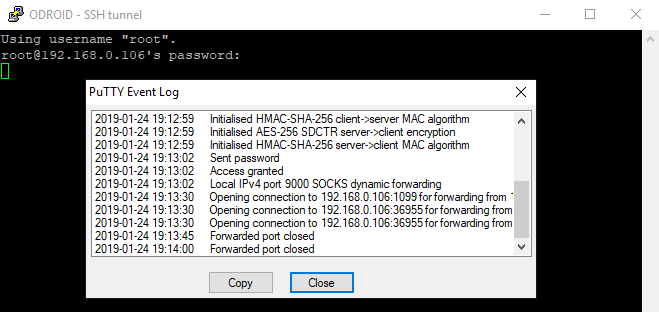
Connect. Is the SSH tunnel established? Right click on the title bar and select “Event log”. You can see the connection is established on port 1099 and a random port. In this case that port is 36955. Minimize this window. When we are finished with VisualVM we can return to this window and terminate the tunnel with ctrl+c.
Step 5. Start remote JVM (with optional arguments for JMX)
If you are okay with only heap memory graphing over time, or you are unable to add any additional startup parameters because the process is already running, you can run the JVM as you normally would and skip this step.
For more powerful profiling abilities (and the ability to perform a heap dump), let’s enable the JMX4 built into Java with some additional properties.
We bypass SSL (TLS) authentication because we are SSH tunneling and we trust the tunnel. Set the JMX port to 1098 so it is easy to remember. The hostname again must the hostname or IP VisualVM connects to. See the warning below.
Remember: With JMX connections you must use a different jmxremote.port for each app you want to deeply profile.
1 2 3 4 5 6 7 8 9 | # Run the original Java command with additional JMX arguments java ... \ -Dcom.sun.management.jmxremote \ -Dcom.sun.management.jmxremote.ssl=false \ -Dcom.sun.management.jmxremote.authenticate=false \ -Dcom.sun.management.jmxremote.port=1098 \ -Dcom.sun.management.jmxremote.local.only=false \ -Djava.rmi.server.hostname=192.168.0.106 \ -Djava.net.preferIPv4Stack=true \ |
-J-Djava.rmi.server.hostname=IP is the same with jstatd and is needed to indicate that our embedded device’s IP is the hostname to work properly with VisualVM. If you connect with a hostname (set in a hosts file) then this parameter is not needed.-Djava.rmi.server.hostname=`hostname -I | cut -f1 -d' '` to automatically get the private server IP address, or use simply `hostname -f` to use the server hostname. Your mileage may vary.There should be no error messages, and your Java app should be running. Let’s look at netstat -tlpn again. JMX opens port 1098 and another random port. Aren’t you glad we used an SSH tunnel and don’t have to configure firewall rules for random ports?
Step 6. Configure the VisualVM SOCKS proxy
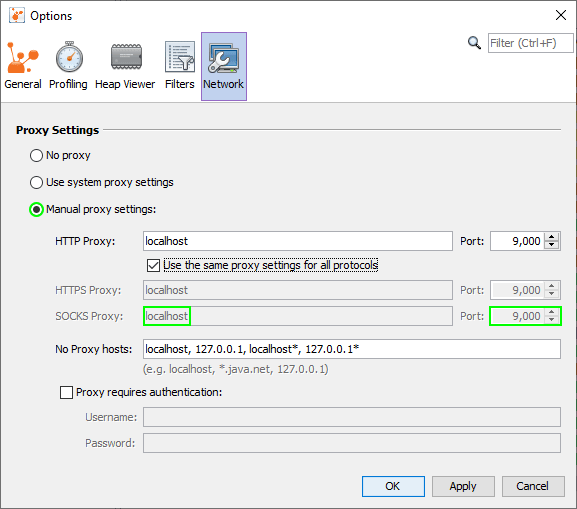
In VisualVM5 select Tools > Options > Network and ensure you enable manual proxy settings with the SOCKS proxy set to localhost (where PuTTY or ssh on Linux is listening) and port 9000. We’re instructing VisualVM to connect through our SSH tunnel via SOCKS.
Step 7. Add remote hosts, JStatD, and JMX connections
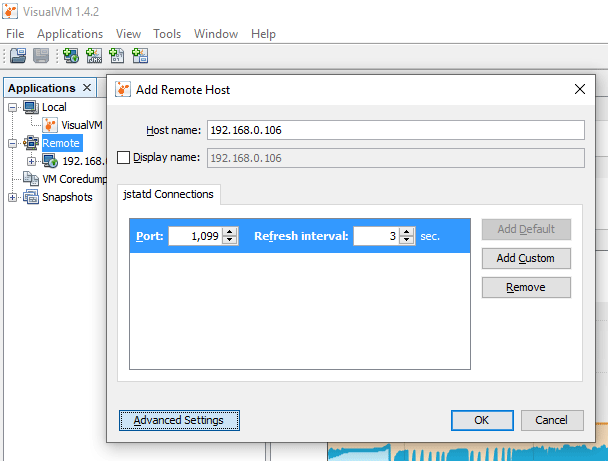
Click on “Remote” in the Applications panel and “Add Remote Host”. Let’s use the same IP or hostname as we did when we set up the JStatD and JMX settings. If you used the IP address 192.168.0.106 then use that again here. The default port is 1099, but you can click “Advanced Settings” to change the JStatD port. We must start with a JStatD connection before we can establish a JMX connection.
Within a few seconds, we’ll see under our new remote host the jstad daemon process and any running JVM apps. This means we’ve succeeded in connecting to JStatD through the SSH tunnel.
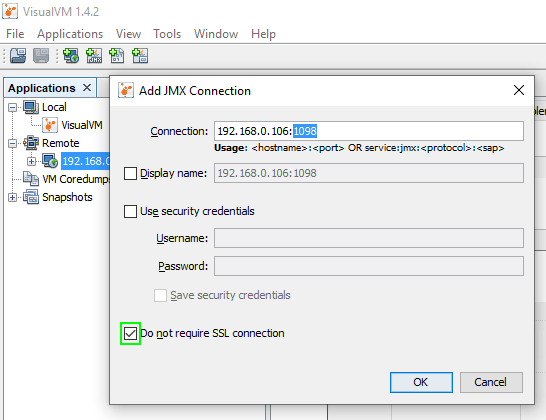
Next, and only if you’ve started a Java app with the additional JMX parameters from above, right click on our remote host and “Add JMX connection”. Let’s use the JMX port 1098 we designated earlier. Leave the security credentials unchecked, but let’s make sure to check “Do not require SSL connection” because we are using an SSH tunnel instead.
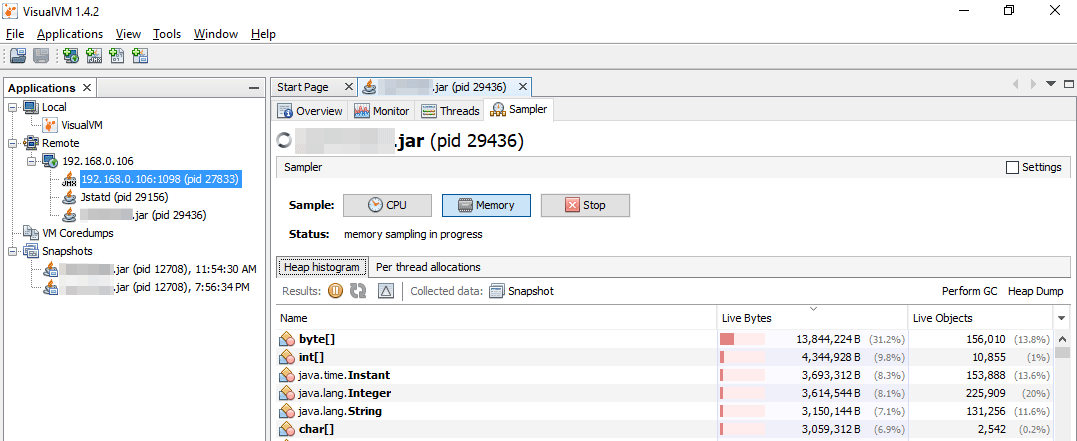
We should now see our running Java app and PID (Process ID) in parenthesis. Double-click on this app name and all the wonderful profiling information reveals itself.
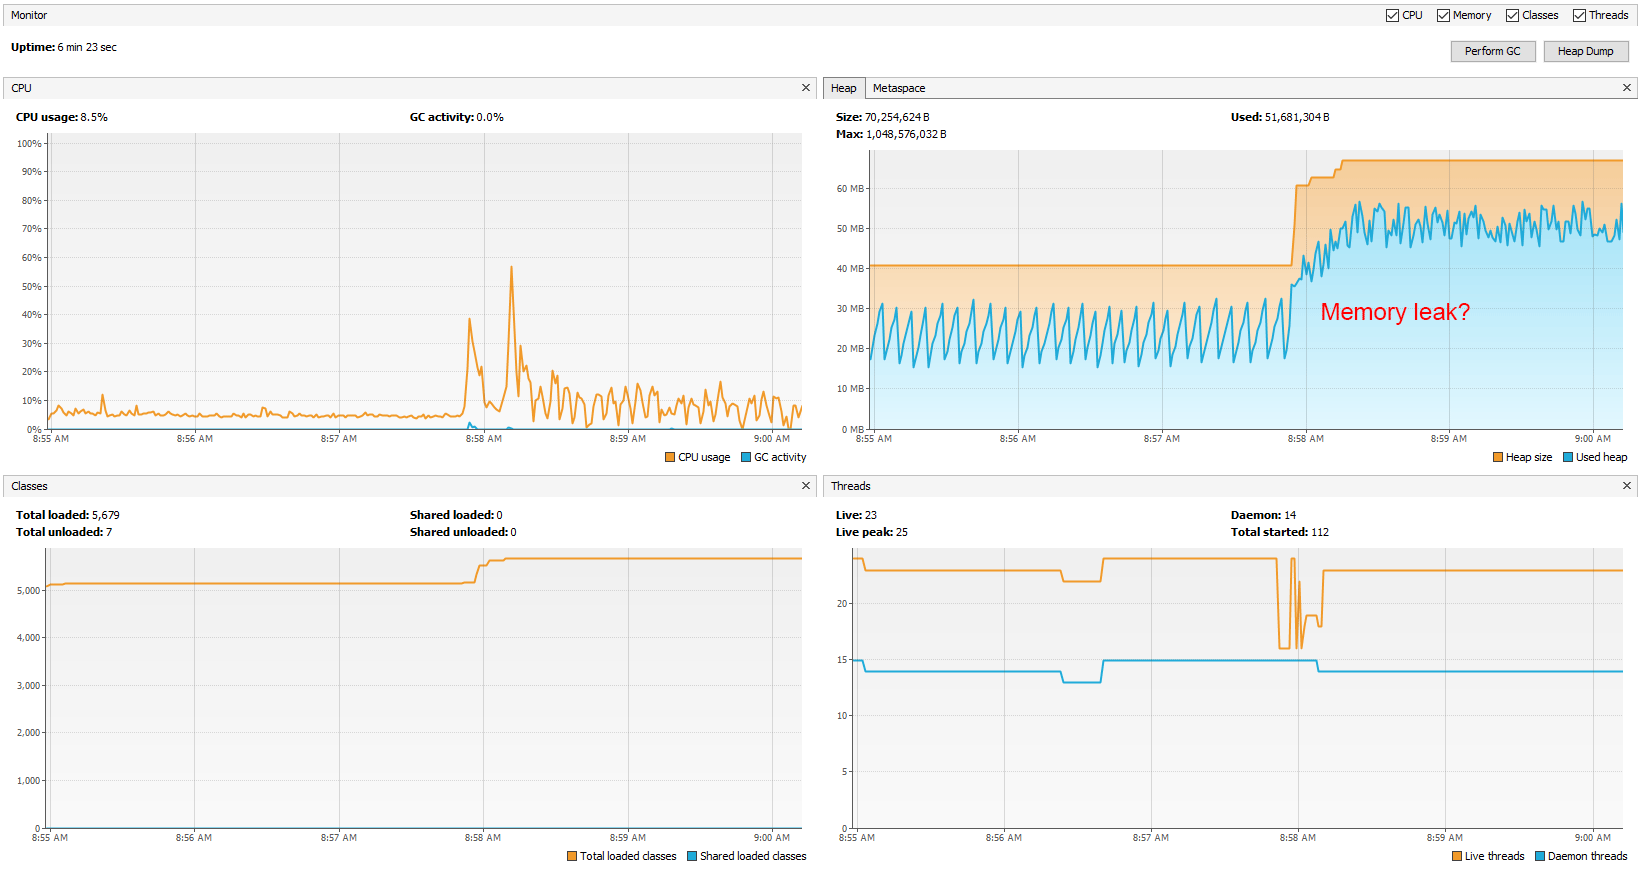
Tools > Options and update the charts cache. I’ve set mine to twelve hours (720 minutes) to adequately catch heap growth.Here are the CPU, heap, number of classes, and number of threads.
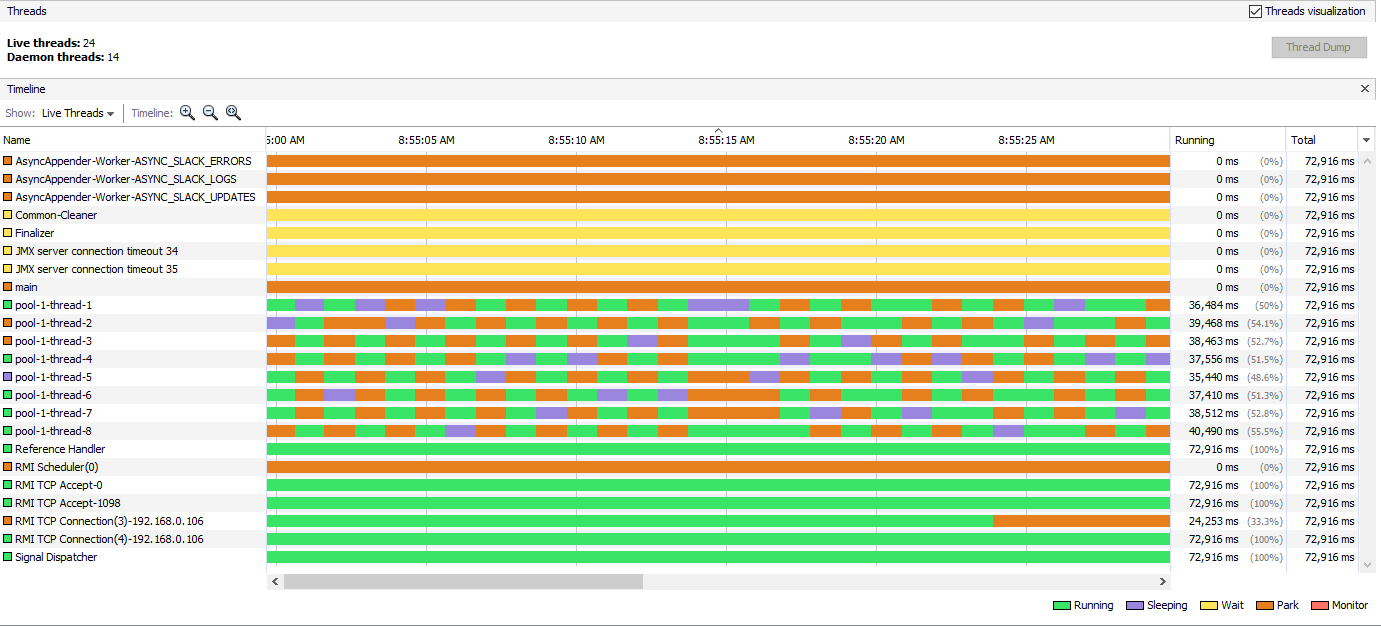
Here is the real-time thread visualization.
Finally, you can see a heap histogram to identify how your memory is distributed.
Oracle Java Mission Control
If you prefer Oracle Java Mission Control, set the SOCKS proxy under Window > Preferences > General > Network Connections with the same localhost:9000 endpoint as above with VisualVM. Close this window and in the JVM Browser pane right click and add the remote connection running JMX. You can specify port 1098 (JMX) directly.

References:
- How to create SSH tunnel using PuTTY in Windows?
- Profiling remote JVM using VisualVM
- How to activate JMX on my JVM for access with JConsole?
- Create a SOCKS proxy on a Linux server with SSH
- VisualVM: Monitoring Remote JVM Over SSH (JMX Or Not)
- Starting jstatd in Java 9+
- VisualVM Documentation
Notes: