GoAccess Web Log Analyzer Installation on CentOS
GoAccess web log analyzer is a beautiful tool to show real-time traffic and stats – including GeoIP information, bandwidth usage, and visitor time distributions – of my web projects and apps over and above Google’s Webmaster Tools and UA reporting.
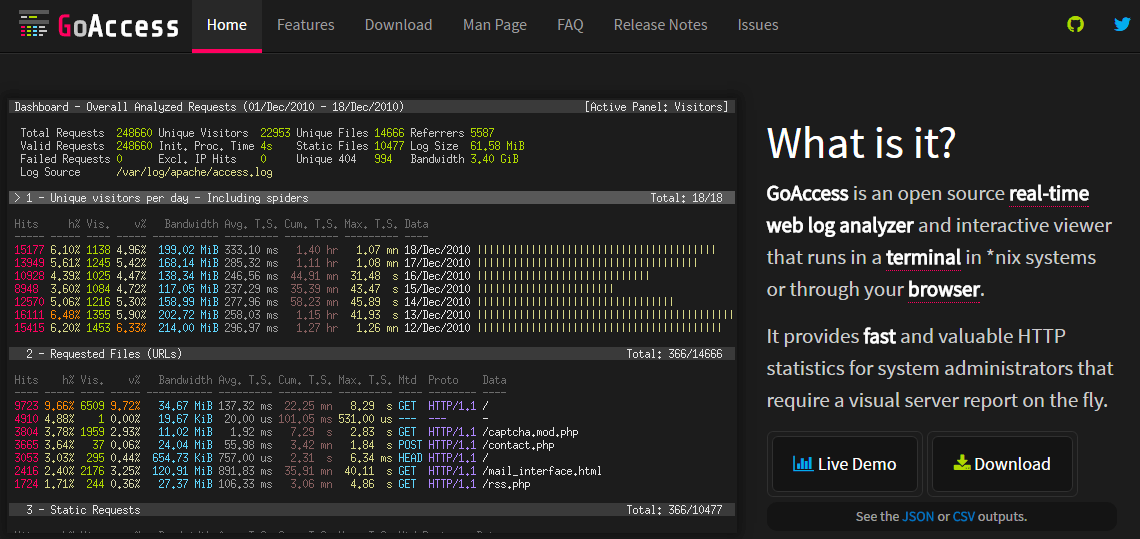
At a glance I can see current traffic and historic traffic just by adding a single html file in a public-facing (password protected) folder (e.g. report.html). It’s quick to set up, uses a WebSocket on the front end for displaying real-time log analysis, and has low server overhead.
Additionally admins can set up the vhost log files’ format to include virtual hosts in order to see the traffic breakdown to the server(s) across all sites and subdomains (For example, if you’re using subdomains for parallel downloading of assets, internal company domains, etc.). It’s easier to install on Debian/Ubuntu, so I’ll share how I installed it on CentOS/RHEL. There are a few gotchas that I’ve mapped out, so I hope this is useful to someone else.
Install GoAccess on CentOS
First, I like to update my system before installing any new major packages. As an elevated user:
1 2 | yum update # or 'apt-get update' on Debian yum upgrade # or 'apt-get upgrade' on Debian |
You can install GoAccess directly for CentOS (e.g. yum install goaccess), but it might be a version or two behind. You could add the official GoAccess Debian repo on Debian or Ubuntu and install from there. In the case of CentOS I chose to make the latest release. Let’s do that.
Configure and Make
Let’s make sure our build tools are installed first:
1 | yum install gcc gcc-c++ kernel-devel make # or 'apt-get install build-essential' on Debian |
To wget the latest GoAccess, go to the official web site and copy the latest download link (at this time it is version 1.2). We’ll wget that below:
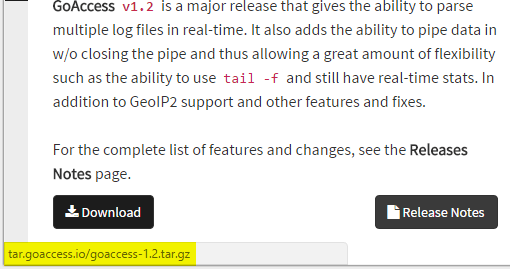
This will install the log analyzer to /tmp/goaccess-1.2. Feel free to move this folder and/or the executable goaccess to your favorite system location.
1 2 3 4 | cd /tmp wget http://tar.goaccess.io/goaccess-1.2.tar.gz tar -xzvf goaccess-* # to untar whichever version you downloaded cd goaccess-* # Should take you to 'goaccess-1.2/' at this time |
Using MaxMind GeoIP2
Since it’s available, let’s use the GeoIP ability integrated in GoAccess. We’ll be using MaxMind’s free GeoIP2 city database. You are able to configure your preferred database, say if you have a commercial version or you’d only like the country DB, in the configuration if you need to do so.
./configure GoAccess you might get this error: “configure: error: *** Missing development files for libmaxminddb library.” First we must install the MaxMind library with yum install libmaxminddb-devel. We can configure the DB path in he config file itself, or on the command line. See https://goaccess.io/manWe’re about to configure and make GoAccess with TLS support (https websocket connections), UTF-8 log support, and MaxMind’s GeoIP2 DB format support.
1 2 3 4 5 | yum install ncurses-devel # for UTF support yum install libmaxminddb-devel # for GeoIP2 database support from MaxMind ./configure --with-openssl --enable-utf8 --enable-geoip=mmdb # be sure not to use 'legacy' for the DB version make make install |
Minimal Configuration of GoAccess
We can now test out GoAccess in the terminal. Assuming your logs are in /var/log/httpd/, you can run the following. Adjust the path for your log files.
1 | ./goaccess -f /var/log/httpd/access.log |
Out of the box, the NCSA combined log format is probably what most Apache servers are configured with. There is the ability to analyze combined virtual host files if, say, all your virtual servers write to the same log file. See https://goaccess.io/man for details. Let’s use a per-host log file setup for now.
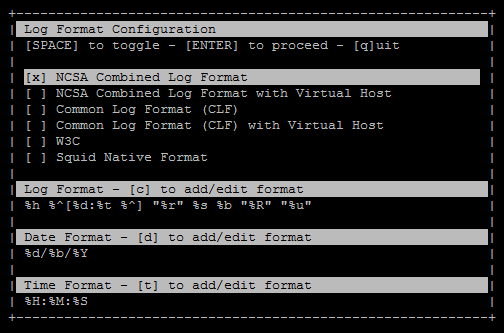
After pressing down once, hitting space on NCSA, and hitting enter, you should see a similar screen to this one:
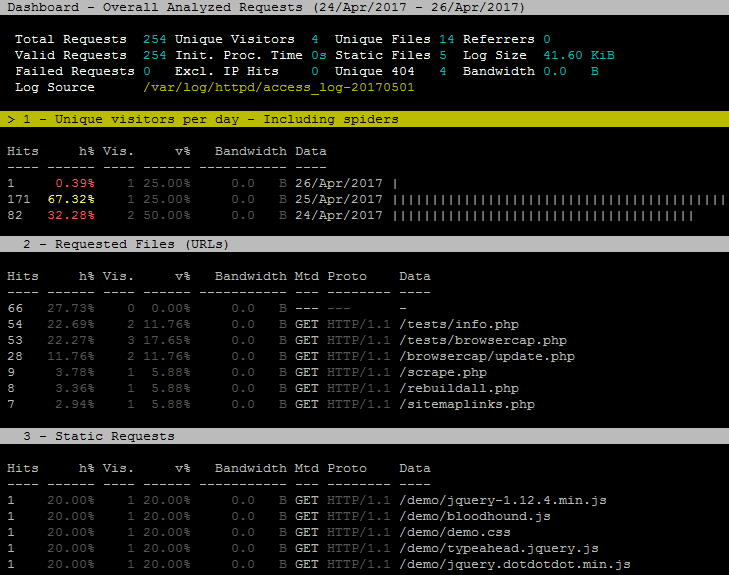
You can quit by pressing q.
To get the beautiful reports updated in real-time through a WebSocket we need to edit a configuration file.
goaccess.conf has not been configured yet. See below.To find out the default config path, you can use the --dcf switch (dcf = “default config file”):
1 2 | > ./goaccess --dcf /usr/local/etc/goaccess.conf |
Out of the box we can edit this config file with vi/nano/gedit or anything you like. I prefer editing config files over SFTP in Notepad++ myself. Uncomment the time-format of your web server logs. In my case I’m using plain Apache 2.4.6 (not FastCGI/FPM), so the time format on line 13 is fine.
10 11 12 13 14 15 16 17 18 | # The following time format works with any of the # Apache/NGINX's log formats below. # time-format %H:%M:%S # # Google Cloud Storage or # The time in microseconds since the Unix epoch. # #time-format %f |
time-format %H:%M:%S %Z with the added %Z.Next we will need to specify a log date format. Again under Apache, the date format on line 36 is the one I want.
33 34 35 36 37 38 39 40 | # The following date format works with any of the # Apache/NGINX's log formats below. # date-format %d/%b/%Y # # AWS | Amazon CloudFront (Download Distribution) # AWS | Elastic Load Balancing # W3C (IIS) |
Next, specify a log format. With Apache out of the box it’s usually the NCSA combined log format (which includes the referrer %R and the user-agent string %u). Here is what a typical httpd.conf looks like around the log format section:
191 192 193 194 195 196 197 | <IfModule log_config_module> # # The following directives define some format nicknames for use with # a CustomLog directive (see below). # LogFormat "%h %l %u %t "%r" %>s %b "%{Referer}i" "%{User-Agent}i"" combined #LogFormat "%h %l %u %t "%r" %>s %b" common |
We can see that the “combined” log format matches the NCSA combined format. Let’s use that:
60 61 62 63 64 65 66 67 | # NOTE: If the time/date is a timestamp in seconds or microseconds # %x must be used instead of %d & %t to represent the date & time. # NCSA Combined Log Format log-format %h %^[%d:%t %^] "%r" %s %b "%R" "%u" # NCSA Combined Log Format with Virtual Host #log-format %v:%^ %h %^[%d:%t %^] "%r" %s %b "%R" "%u" |
The default goaccess.conf file is about 718 lines long. The above three settings are the bare minimum required to enable the web dashboard. Start the GoAccess server on default port 7890:
1 | ./goaccess -f /var/log/httpd/access_log -o /var/www/html/report.html --real-time-html |

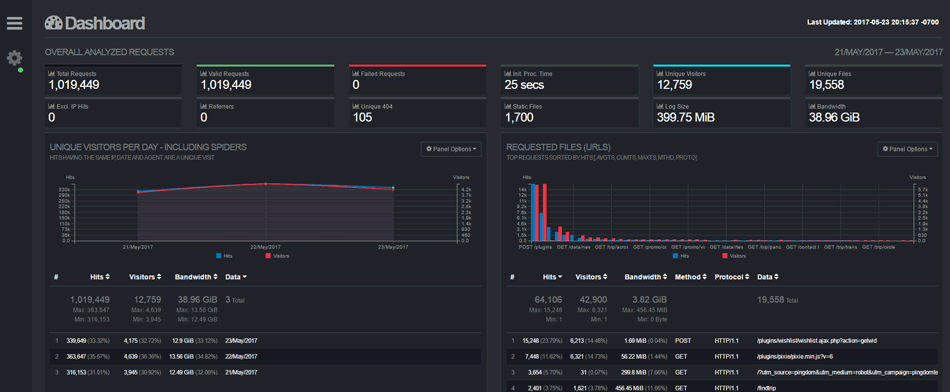
Assuming you have a virtual host or the default host enabled, and Apache running, you can navigate to http://127.0.0.1/report.html or http://localhost/report.html. You should see a dashboard like so:
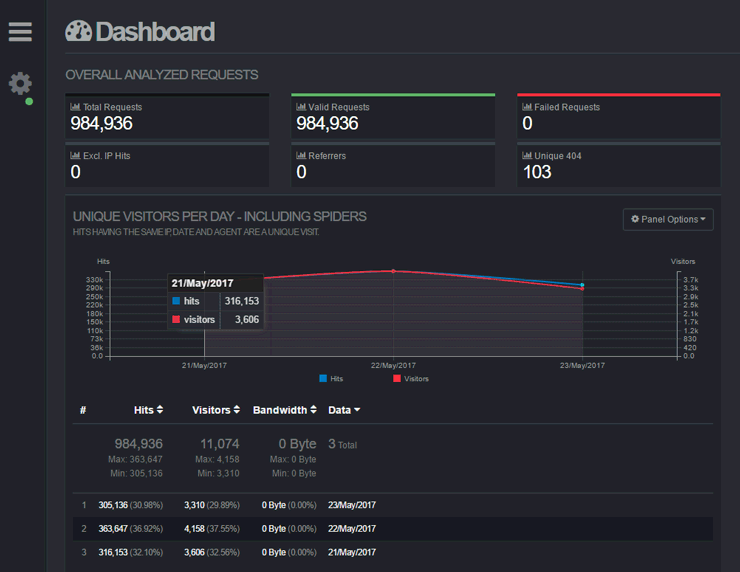
iptables -A INPUT -p tcp --dport 7890 -j ACCEPT and service iptables restart, or for FirewallD: firewall-cmd --permanent --zone=public --add-port=7890/tcp and systemctl restart firewalld). You can configure any port to bind to, actually.With this beautiful log analyzer now running, we can customize the colors, panels, IP exclusions, filters, and so much more. See https://goaccess.io/man for all the configuration options.
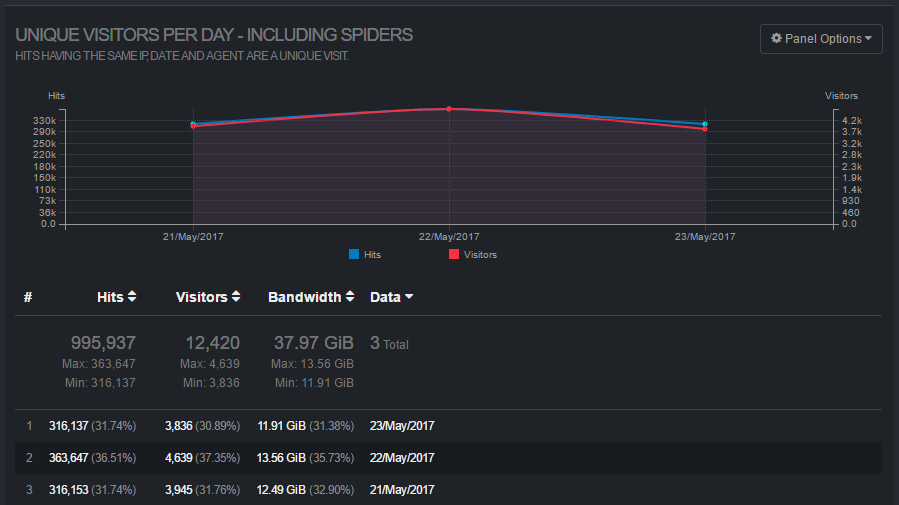
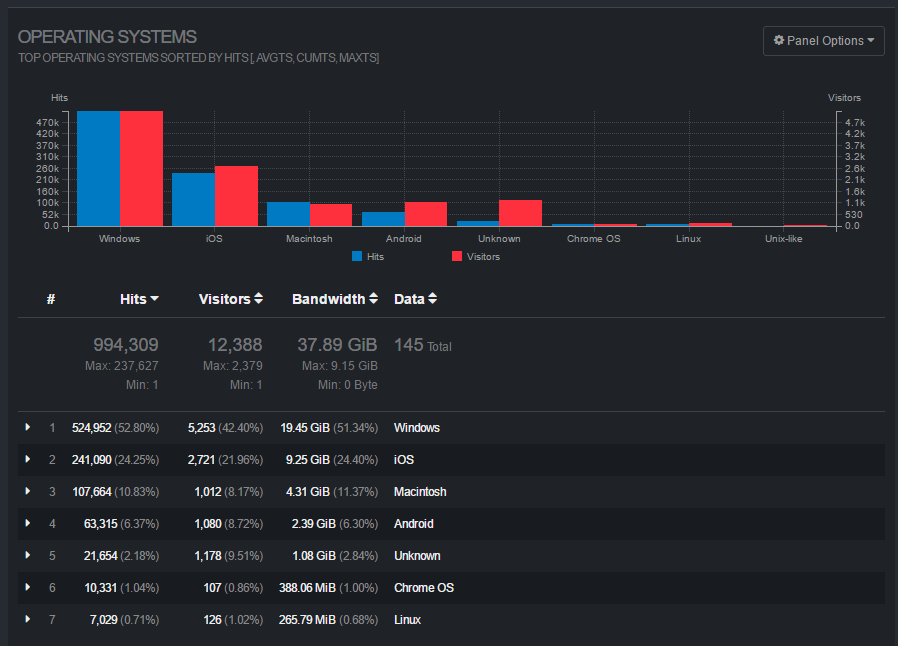
Sample Log Panels
I’ll finish with some sample panels to highlight the features of GoAccess.
Bandwidth Usage
Top Browsers
Time Distribution
