Cleaning Raw Candle Data for Time-Series Analysis

Problem: How to clean the raw OHLCV candle data from the broker for time series analysis?
Suppose we have an autonomous program that prioritizes and continually downloads the latest minute and day candles, as well as periodically gets new symbols from the broker. The problem is that the candles are not guaranteed to be full-period candles, or even valid. For example, if the program requests a day candle from the API in the middle of the trading day, it will not be a full-period candle. A similar call to the API an hour later may yield an OHLCV1 candle that has the same [O]pen, but different HLCV values.
Partial period day candle cases
There are three partial day-candle end cases to consider:
Case 1: Ending before the market opens
There could be pre-market trading. In this case, hold on to the candle, but do not mark it as valid.
Case 2: Ending before the market closes
As with case 1, hold on to this candle, but do not mark it as valid.
Case 3: Ending before the day ends
Hold on to this candle, but still do not mark it as valid. Because a candle came in after trading finished, copy this candle and set the start and end timestamps to the beginning and end of the trading day (midnight to midnight), and mark this candle as valid. The goal is to not modify the raw candles2, but add a full-period candle I can be reasonably certain represents the candle period. A subsequent candle that comes in under case 3 is added to the database, and the generated candle is updated.
If a full-period candle comes in after a generated candle, then the generated candle is replaced and given a status of alreadyValid.
The reason I mark my candles with a status (validity flag) is so that upon analysis I can recall just the valid candles to ensure they are full-width candles. Without this cleaning step, if for instance five day candles for the same day make their way into a time series analysis, it would confuse the analysis and perhaps lead to erroneous moving average calculations. The cleaning can either be performed at analysis time, each and every time, or it can be done once and saved to the database.
For all other candle periods I require a 90% period span (e.g. a 5-minute candle needs to span at least 4.5 minutes) to generate a valid full-period candle. I don’t go higher than a day-candle, however, so this applies best to minute candles and hourly candles.
Examples:
AAPL on July 2, 2015
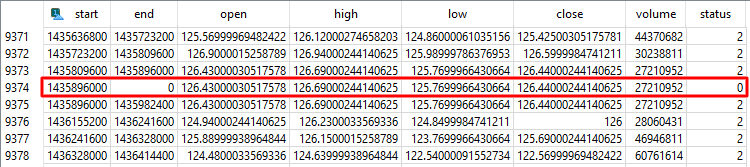
Here, the API looks like it glitched out and returned a candle with a bad closing timestamp. The one before it spanned Thursday, July 2, 2018, and the one after it spanned Friday, July 3, 2018. However, upon further inspection it looks like AAPL did not trade the next day on Friday, July 3, 2015 (that is why the volume and OHLC prices are the exact same). It was in fact American Independence Day observed. Perhaps an improvement to the cleaning algorithm is to consider identical subsequent volumes as well?

AAPL on May 30, 2018
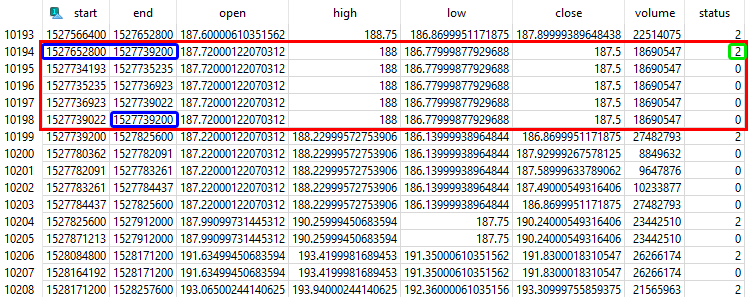
Here there are several partial day-candles on multiple days. Outlined are 5 raw candles all for the same day. Below are even more examples (not outlined). The green outlined “2” indicates that this candle was in fact a raw candle that eventually came in, and the cleaning algorithm recognized that and marked it as alreadyValid.
AAPL on July 31, 2018
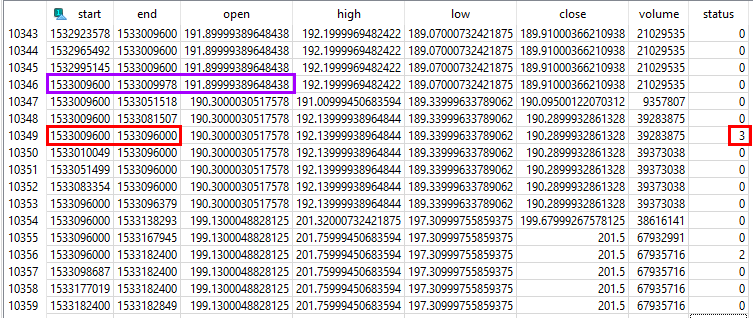
This last example shows that uncleaned raw candles that start on given day may have the wrong opening price! Outlined in purple on line 10346 you can see the start timestamp is Tuesday, July 31 at 00:00 and this candle has a duration of only 6 minutes and 18 seconds, yet it has an opening price which is the price AAPL opened the previous day (191.90). The next raw candle to come in also starts at midnight, but it has a duration that ends about 2 hours into trading that day, so it should have a real [O]pen value (190.30). Some more candles come in, but none span the entire day, so a generated candle is recorded on line 10349, outlined in red, with a status of “3” meaning generated. This is the candle that would be used in a time series analysis.
Notes: